

Toronto’s October Market: Where Homes Are Selling Fastest, and Where They’re Sitting
November 4, 2026
If you only read the headlines, you’d think Toronto real estate stalled in October. Sales were down, prices were down, and buyers are cautious.
But when I dug into TRREB’s October numbers area by area, I found two completely different markets. In some neighbourhoods, homes sold in under two weeks for well over asking. In others, they sat for months and sold for less than the sellers hoped.
The difference isn’t luck. When you line up the best performing areas side by side, they have a lot in common, and understanding why is the key to buying or selling well right now.
The big picture
Across the GTA, October sales fell 7.9% from last year to 5,603, and the average price dipped 2.7% to $1,024,108. New listings dropped even more, down 11.9%, so sellers are holding back too.
In the City of Toronto, 2,184 homes sold at an average of $1,075,627. There were 4.6 months of inventory, homes took 30 days to sell on average, and they sold for 98% of asking. On paper, that’s a balanced market.
The averages hide what’s really going on underneath:
- Semi detached: $1,225,229 average, up 0.5% from last year, selling at 102% of asking in 18 days.
- Detached: $1,603,886, down 1.2%, selling at 97% of asking in 24 days.
- Condo apartments: $659,214, down 5.6%, with 5.5 months of inventory.
Semis are the only major home type in Toronto selling over asking on average, and condos are carrying most of the weakness.
The hottest areas
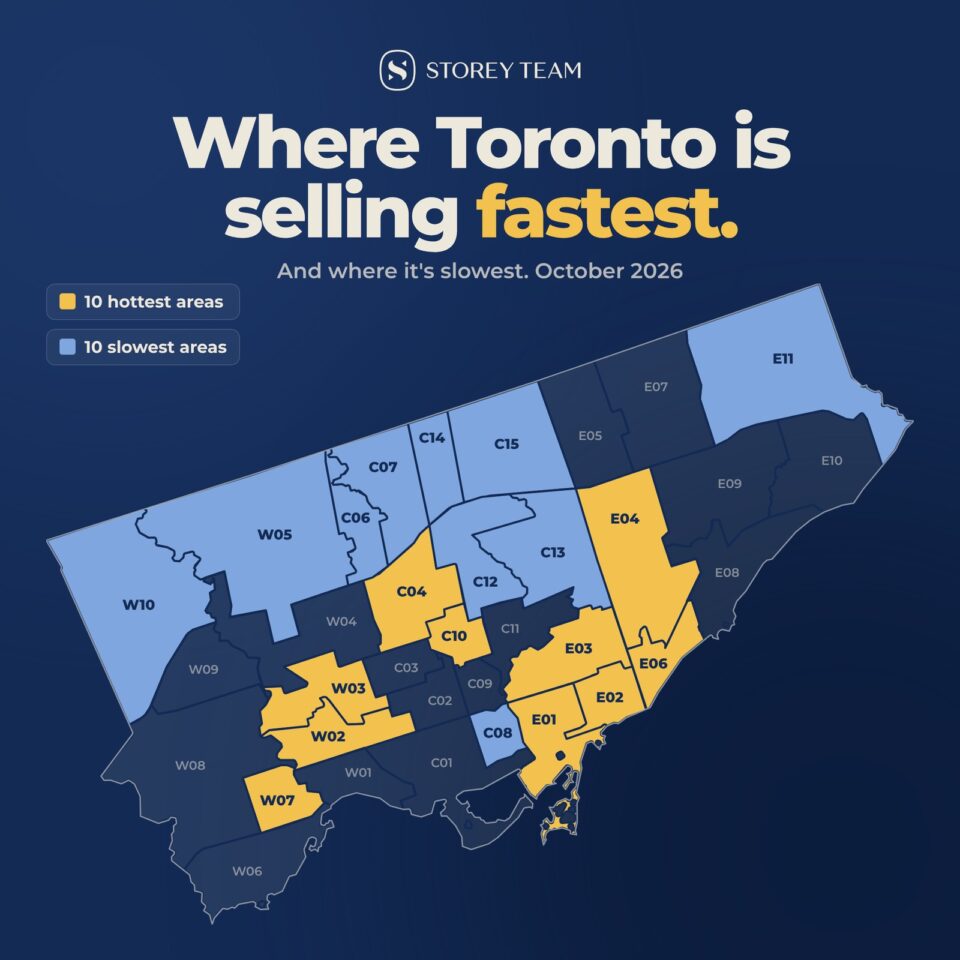
I ranked every TRREB district in Toronto on three things at once: months of inventory, days on market and sale to list price. The east end swept the top three, and Leslieville led the city at 13 days and 106% of asking.
| Rank | Area | Months of inventory | Days on market | Sale to list | Avg price (all types) |
|---|---|---|---|---|---|
| 1 | Leslieville, Riverdale (E01) | 2.4 | 13 | 106% | $1.24M |
| 2 | The Beaches, Woodbine (E02) | 2.3 | 17 | 104% | $1.26M |
| 3 | Danforth Village, East York (E03) | 2.8 | 21 | 101% | $1.11M |
| 4 | Junction, Bloor West Village (W02) | 2.7 | 22 | 101% | $1.27M |
| 5 | Stonegate, Queensway (W07) | 3.9 | 20 | 100% | $1.18M |
| 6 | Mount Pleasant, Davisville (C10) | 3.8 | 21 | 99% | $1.06M |
| 7 | Keelesdale, Weston (W03) | 3.4 | 29 | 100% | $818K |
| 8 | Wexford, Dorset Park (E04) | 3.7 | 28 | 99% | $792K |
| 9 | Birchcliffe, Oakridge (E06) | 4.3 | 28 | 101% | $1.03M |
| 10 | Lawrence Park, Bedford Park (C04) | 4.0 | 20 | 97% | $2.20M |
The top four are all under three months of inventory, which is seller’s market territory, while the city as a whole sits at 4.6.
The slowest areas
On the same three measures, the slowest parts of the city were mostly in North York and the outer edges of Toronto. Bridle Path had a full 9 months of inventory, and most of this list sold at 95% to 97% of asking.
| Rank | Area | Months of inventory | Days on market | Sale to list | Avg price (all types) |
|---|---|---|---|---|---|
| 1 | Willowdale East (C14) | 5.8 | 36 | 96% | $983K |
| 2 | Bridle Path, St. Andrew (C12) | 9.0 | 30 | 94% | $2.51M |
| 3 | Willowdale West, Newtonbrook (C07) | 5.5 | 40 | 97% | $1.11M |
| 4 | Bayview Village, Hillcrest (C15) | 4.6 | 37 | 95% | $860K |
| 5 | Banbury, Don Mills (C13) | 4.9 | 34 | 95% | $1.03M |
| 6 | Church Yonge, Moss Park, St. Lawrence (C08) | 6.0 | 33 | 97% | $707K |
| 7 | Downsview, York University (W05) | 5.7 | 38 | 98% | $767K |
| 8 | Rexdale, West Humber (W10) | 5.2 | 34 | 96% | $762K |
| 9 | Bathurst Manor, Clanton Park (C06) | 5.3 | 31 | 95% | $812K |
| 10 | Malvern, Rouge (E11) | 5.2 | 38 | 98% | $698K |
Many of these areas are dominated by condos, and the ones that aren’t, like Bridle Path, sit at the very top of the price range. I’ll come back to why that matters.
The best home type and area combos
This is where it gets really interesting. When I paired each home type with each area (only pairings with at least 10 sales), all 10 of the hottest combos were freehold houses, and semis took seven of the spots.
| Rank | Home type and area | Months of inventory | Days on market | Sale to list | Avg price |
|---|---|---|---|---|---|
| 1 | Detached, Leslieville (E01) | 1.1 | 10 | 106% | $1.65M |
| 2 | Semi, High Park, Roncesvalles (W01) | 0.9 | 9 | 105% | $1.41M |
| 3 | Semi, The Beaches (E02) | 1.2 | 12 | 105% | $1.24M |
| 4 | Semi, Leslieville (E01) | 1.6 | 13 | 108% | $1.26M |
| 5 | Semi, Danforth Village, East York (E03) | 1.6 | 14 | 103% | $1.05M |
| 6 | Detached, The Beaches (E02) | 2.0 | 13 | 104% | $1.49M |
| 7 | Semi, Junction, Bloor West Village (W02) | 2.1 | 17 | 105% | $1.28M |
| 8 | Detached, Junction, Bloor West Village (W02) | 1.8 | 13 | 100% | $1.78M |
| 9 | Semi, Annex, Yorkville, Casa Loma (C02) | 1.8 | 16 | 101% | $1.80M |
| 10 | Semi, Forest Hill South, Humewood (C03) | 1.2 | 14 | 99% | $1.20M |
Some of these pockets have barely a month of supply. At that pace, a well priced home in the right neighbourhood is getting multiple offers, even in a market the headlines call slow.
What the winners have in common
Look at that list again and a pattern jumps out. Leslieville, the Beaches, High Park, Roncesvalles, the Danforth, East York and Bloor West Village are all different neighbourhoods, but they’re selling for the same reasons.
They’re single family neighbourhoods built for families. These are streets of houses, not towers. Buyers here want a backyard, space for kids and a real neighbourhood feel, with parks, local shops and transit nearby.
They have well regarded schools. For a lot of families, the school catchment is the first filter they set when they start looking. These neighbourhoods check that box, and that keeps a steady stream of buyers coming no matter what the headlines say.
The price points are within reach. Seven of the ten hottest combos averaged under $1.5M, and every detached pairing on the list was under $2M ($1.49M to $1.78M). Compare that to detached homes in Lawrence Park at $2.73M or Bridle Path at $3.22M.
Dual incomes make them affordable, especially semis. A semi at $1.05M to $1.3M is realistic for a lot of professional couples with two incomes. In many other parts of the city, a detached home in a similar family neighbourhood costs far more. That’s why semis took seven of the ten spots and sold at 102% of asking citywide.
Put those together and you get the most in demand homes in Toronto: a family friendly freehold house, in a great school area, at a price two working parents can actually carry. That buyer pool is huge, and the supply of these homes is tiny.
Why the slow combos are slow
The bottom of the list tells the same story from the other side. There are two reasons homes are sitting, and neither one means these are bad places to own.
Higher prices mean a smaller buyer pool. Detached homes in Bridle Path averaged $3.22M, had 10.4 months of inventory and sold at 93% of asking. Willowdale East detached averaged $2.00M and sold at 96%. Far fewer buyers can shop at those prices, so even beautiful homes take longer and need sharper pricing.
Condos have a supply problem. Condo apartments filled eight of the ten slowest combos, at averages from $406K to $804K. Condos in Downsview and York University had 9.1 months of inventory, and citywide there are 5.5 months of condo supply. Buyers have lots of choice and they’re taking their time.
The clearest example is High Park. Semis there sold in 9 days, the fastest pairing in the city, while condos in the same area took 51 days, the slowest. Same neighbourhood, completely different market, because one product is scarce and the other isn’t.
What this means for you
If you’re selling a family home in one of these pockets, you’re in a strong position. Buyers are competing for very few homes, so preparation and the right pricing strategy can still get you a great result.
If you’re selling a condo or a high end home, the market is more selective. Pricing it right from day one matters more than ever, because buyers have options and they know it.
If you’re buying a family home in these neighbourhoods, expect competition and be ready to move quickly. If you’re buying a condo, this is one of the best negotiating windows we’ve seen in years.
Slow doesn’t mean bad. It means pricing and strategy matter more. If you want to know how your neighbourhood and your type of home are performing right now, reach out to me and my team.
Frequently asked questions
What are the hottest neighbourhoods in Toronto right now?
In October 2026, the hottest areas in Toronto were Leslieville and Riverdale (E01), the Beaches (E02), Danforth Village and East York (E03), and the Junction and Bloor West Village (W02). All four had under three months of inventory and sold above asking on average. Leslieville led the city, with homes selling in 13 days at 106% of asking.
Which Toronto neighbourhoods are selling the slowest?
The slowest areas in October 2026 were Willowdale East (C14), Bridle Path and St. Andrew (C12), Willowdale West (C07) and Bayview Village (C15). Homes there took 30 to 40 days to sell on average and went for 94% to 97% of asking. Bridle Path had 9 months of inventory, the most of any district in the city.
What type of home is selling fastest in Toronto?
Semi detached homes are the strongest home type in Toronto. In October 2026, they averaged $1,225,229, sold at 102% of asking and took 18 days to sell. Detached homes sold at 97% of asking in 24 days, and condo apartments had 5.5 months of inventory.
Why are semi detached homes in such high demand in Toronto?
Semis offer a freehold house with a yard in a family neighbourhood at a price many dual income couples can afford. In the hottest areas they average about $1.05M to $1.4M, far less than a detached home nearby. That combination of space, location, schools and price creates a huge buyer pool chasing very few listings.
Is Toronto a buyer’s market or a seller’s market?
Overall, the City of Toronto was a balanced market in October 2026, with 4.6 months of inventory and homes selling at 98% of asking. But it depends on the home and the area. Family freehold homes in east end and west end neighbourhoods are a seller’s market, while condos and high end detached homes favour buyers.
Why are Toronto condos selling slowly?
Toronto condos are selling slowly mainly because of supply. There are 5.5 months of condo apartment inventory citywide, and condo apartments made up eight of the ten slowest home type and area pairings in October 2026. The average condo apartment price was $659,214, down 5.6% from a year earlier.
How long does it take to sell a house in Toronto?
The average home in the City of Toronto sold in 30 days in October 2026. In the hottest pockets it was much faster: semis in High Park sold in 9 days and detached homes in Leslieville in 10 days. In the slowest pairings, which were mostly condos, it took 34 to 51 days.
Are home prices going down in Toronto?
Across the GTA, the average price in October 2026 was $1,024,108, down 2.7% from a year earlier. The change depends on the home type. In the City of Toronto, semi detached prices rose 0.5% and townhouses rose 4.2%, while detached homes fell 1.2% and condo apartments fell 5.6%.
What does months of inventory mean in real estate?
Months of inventory is how long it would take to sell every active listing at the current pace of sales, calculated as active listings divided by monthly sales. Under three months is generally a seller’s market, three to six months is balanced, and over six months is a buyer’s market.
Source: TRREB Market Watch, October 2026. Area rankings use TRREB’s months of inventory trend, average days on market and average sale to list price. Home type and area combos include pairings with 10 or more October sales.